Marblehead Schools Second to Last Against Comparable Districts

Welcome back to Marblehead Beacon’s multi-part series offering a comprehensive analysis of our local schools. As explained in the introductory article last week, this series focuses on providing data evaluating Marblehead against comparable communities within Massachusetts in terms of socio-economic status, size, and other factors, as well as against communities that consistently rank in the top ten in Massachusetts for school performance and are therefore considered aspirational.
The series begins here with a discussion of the results from the 2022 Massachusetts Comprehensive Assessment System (MCAS), recently released for all school districts across the Commonwealth. MCAS is administered every year to students in grades three through eight in two subject areas: Mathematics and English Language Arts (ELA). In addition, students in fifth and eighth grades take a Science and Technology/Engineering (Science) MCAS test. High school students also take MCAS tests that must be passed in order to graduate, but this analysis focuses on the tests administered to younger students.
Every student who takes the MCAS receives one of four designations based on their performance: “exceeding expectations,” “meeting expectations,” “partially meeting expectations,” and “not meeting expectations.” This analysis details the overall performance of Marblehead’s students across multiple grade levels and compares this performance, focusing first on the comparable communities of Andover, Belmont, Hingham, Lynnfield, Needham, Swampscott, and Winchester. All of these towns have long been included on the School Committee’s comparable communities report, which used to be produced annually but has not been generated or made available for several years.
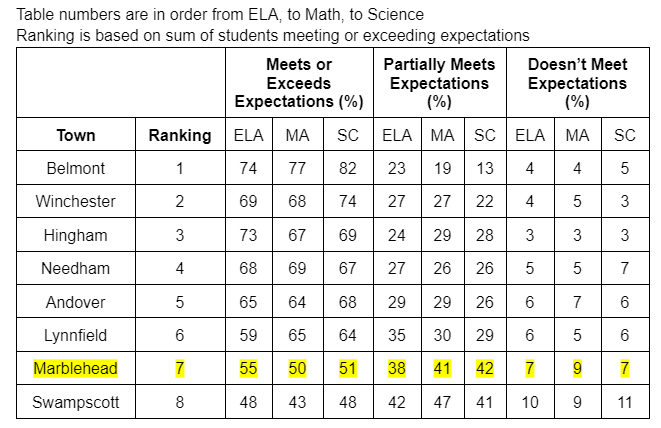
In Marblehead, for students in grades three through eight, the number of students meeting or exceeding expectations in all three subjects (Math, ELA, and Science) ranges from 50 percent to 55 percent. Of the comparable communities listed above, only Swampscott scores lower, with approximately 43 percent to 48 percent of students meeting or exceeding expectations in all three testing categories. All of the other communities in our analysis had a higher percentage of students scoring in the meeting or exceeding range, with Hingham (67 percent to 73 percent) and Belmont (74 percent to 82 percent) topping the list.
The chart below shows the data representing individual towns’ performances across the ELA, Math, and Science MCAS tests. The table beneath the chart offers a more detailed breakdown of the data.
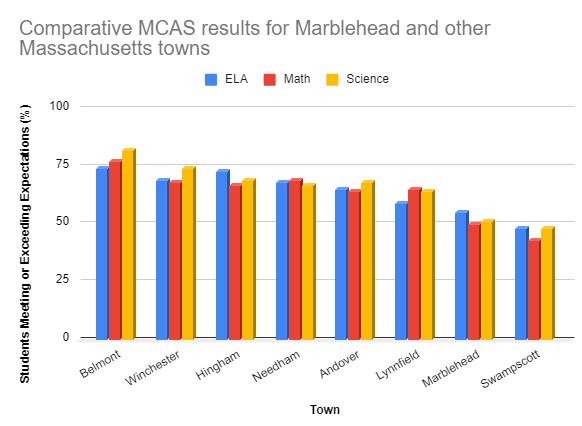
With regard to some of the top-performing school districts in Massachusetts–including Lexington, Wayland, Wellesley, and Weston–students taking the Math, ELA, and Science MCAS tests scored in the meeting or exceeding expectations range at least 70 percent of the time across all categories.
A number of theories are often raised to explain Marblehead’s relative performance in comparison to other districts, including student-teacher ratios, spending per student, teacher salaries, prevalence of students with special needs, and other factors. Stay tuned as these topics are explored in more detail in future articles in this series.
Editor's Note: An earlier version of this article's graph misspelled "comparative"
RELATED ARTICLES