Marblehead Spends More Per Student But Pays Teachers Less Than Most Comparable Towns

Welcome back to Marblehead Beacon’s multi-part series offering a comprehensive analysis of our local schools.
Last week’s article focused on the statewide MCAS exam, on which Marblehead’s public school students scored below those in six out of seven comparable districts. Potential explanations for this performance include factors such as teacher pay, overall spending per student, and student-teacher ratio–all of which are discussed in detail below.
The comparable communities used in this analysis are Andover, Belmont, Hingham, Lynnfield, Needham, Swampscott, and Winchester–all towns that have long been included on the School Committee’s comparable communities report, which used to be produced annually but has not been generated or made available for several years.
Teacher Pay Below Comparable Districts
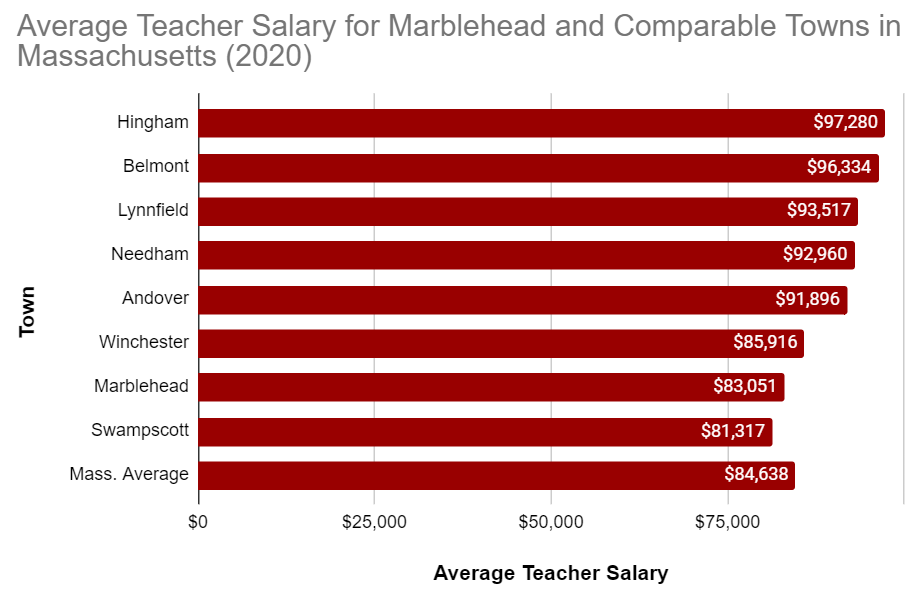
In 2020, the most recent year for which figures are available, teachers at Marblehead’s five public schools (Brown, Glover, Village, Veterans, and Marblehead High School) received an average annual salary of $83,051. Of the comparable communities, only Swampscott paid teachers less, at $81,317. The remaining six comparable communities all paid higher teacher salaries, and the statewide average of $84,638 also exceeded Marblehead’s pay rate.
Spending Per Student Exceeds Most Comparable Districts
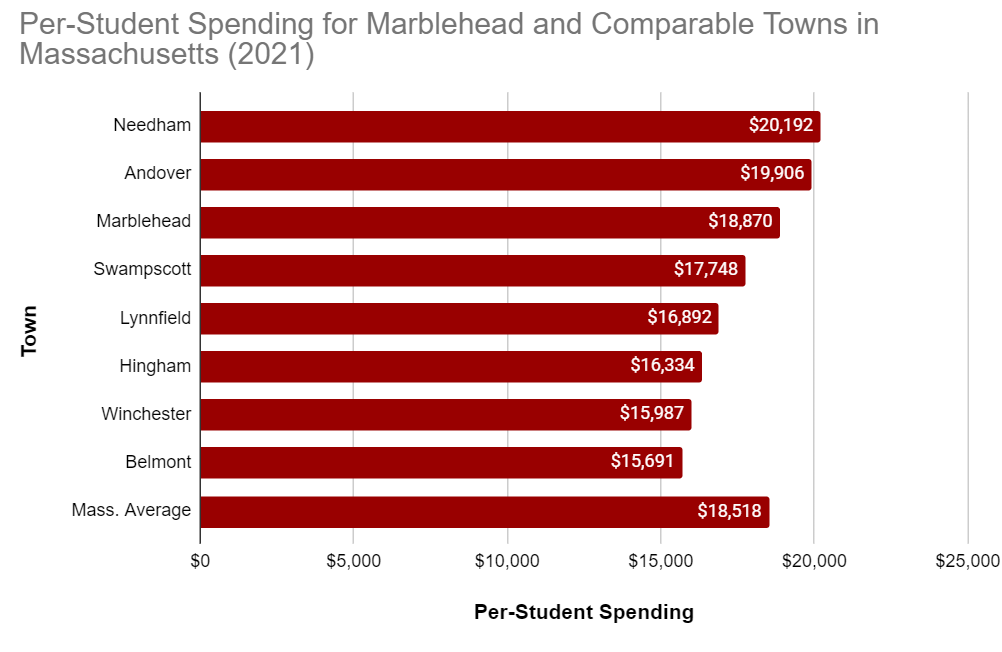
With annual in-district spending per student of $18,870 during 2021, Marblehead ranks toward the top in this analysis. Andover and Needham both spend more, at $19,906 and $20,192, respectively. All other comparable communities spend less in district per student, with Belmont bringing up the rear, at $15,691 per student annually. Marblehead also spends slightly more per student than the state average, which is $18,518.
Lowest Student-Teacher Ratio of All Comparable Districts
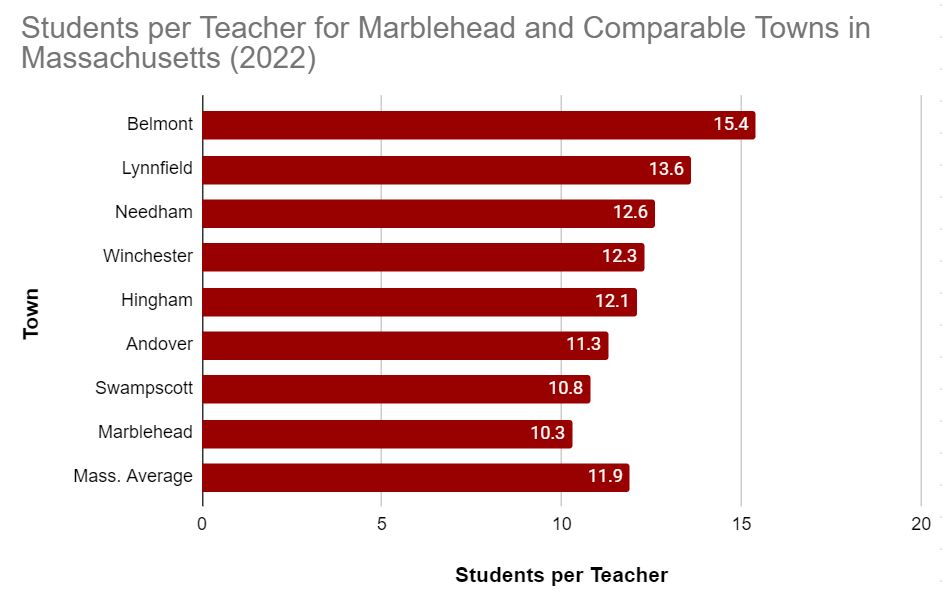
The final relevant data point in this analysis is the number of students, on average, assigned to each teacher. Of the communities analyzed, Marblehead has the lowest student-teacher ratio, at 10.3 students on average per teacher. This ratio is below that of all other comparable communities, and also below the state average of 11.9.
Correlation of Salaries/Spending/Ratios with MCAS Scores
As presented last week, the 2022 MCAS results placed Marblehead in seventh place among comparable districts, outperforming Swampscott but falling short compared to Belmont, Winchester, Hingham, Needham, Andover, and Lynnfield. Belmont topped the list, with between 74 and 82 percent of students meeting or exceeding expectations in English Language Arts, Math, and Science. This compares to Marblehead’s MCAS performance, which showed 50 to 55 percent of students meeting or exceeding expectations in the same categories.
Belmont pays its teachers significantly more than Marblehead does–$96,334 annually on average versus $83,051. Interestingly, however, Belmont spends significantly less annually per student–$15,691 versus $18,870. Belmont maintains a student-teacher ratio of 15.4 students per teacher, while Marblehead is at 10.3.
An interesting analysis also plays out with the second and third-best performing comparable communities according to 2022 MCAS results: Winchester and Hingham. Hingham pays the highest teacher salaries, at $97,280 annually, but Winchester salaries fall toward the bottom of the pack, at $85,916, somewhat above Marblehead and Swampscott but below all other comparable districts used in this analysis. Hingham and Winchester both fall toward the bottom in in-district per-student spending, at $16,334 and $15,987, respectively. In terms of student-teacher ratios, they are in the middle of the pack at 12.1 and 12.3 students, respectively, per teacher.
There are other factors often discussed with regard to MCAS performance, including the number of students with special needs and financial demographics of the student body. Stay tuned as these topics and more are covered in greater detail as this series progresses.
Editor's note: All statistics obtained from the Massachusetts Department of Elementary and Secondary Education website.
RELATED ARTICLES