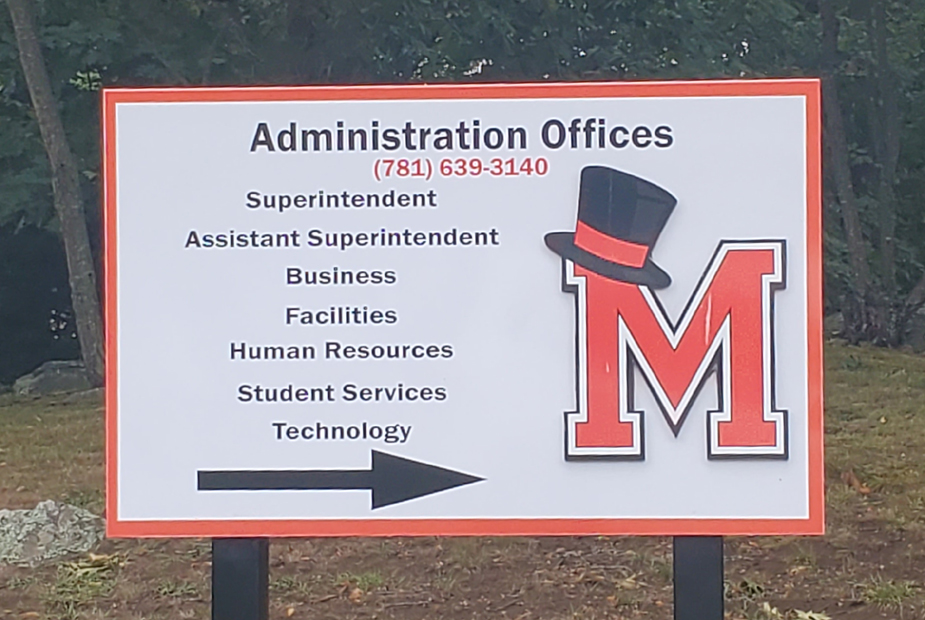
Marblehead's Educational Outcomes vs. Comparable Districts: Part III

For the final piece of Marblehead Beacon’s multi-part series evaluating Marblehead’s MCAS performance, the focus is on exploring underlying financial and population-based statistics for Marblehead as well as the previously-established comparable communities of Andover, Belmont, Hingham, Lynnfield, Needham, Swampscott, and Winchester.
Last week’s article focused on the per-student in-district spending as well as student-teacher ratios in Marblehead Public Schools, demonstrating that Marblehead teachers received lower compensation than all but one comparable district while spending per student is higher than most and student-teacher ratio is lowest. The previous week’s article provided an overview of MCAS scores, showing Marblehead ranking second to last in terms of students performing in the “Meets or Exceeds Expectations” category.
In evaluating educational outcomes in Marblehead in comparison with other districts, it helps to understand the sometimes dry but nevertheless important statistics that define the environment within which a community’s education system operates. These include percentage of students from low-income families, percentage of students classified as “high needs,” percentage of students with disabilities, percentage of students who are non-native English speakers, and percentage of students who are English language learners.
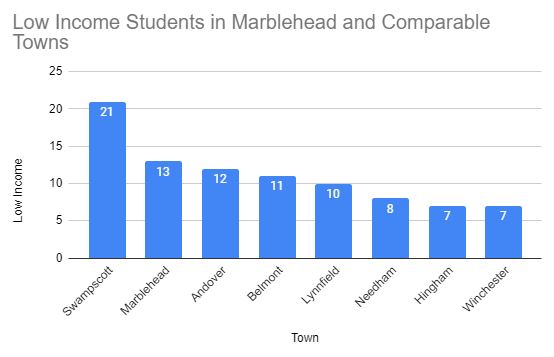
Low-Income Students (%) - Marblehead Slightly Above Average
Marblehead falls in second place with regard to the percentage of students in the district who come from low-income families, though at 13 percent, it is very close to Andover, Belmont, and Lynnfield, which come in at 12 percent, 11 percent, and 10 percent respectively. Swampscott tops the list with 21 percent, and Winchester and Hingham both bring up the rear with seven percent. See the chart below for the complete dataset.
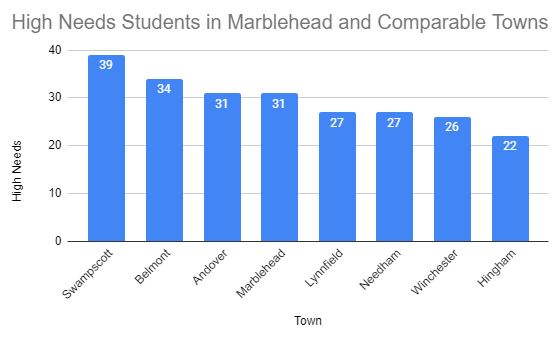
High Needs Students (%) - Marblehead in the Middle
Marblehead fall in the middle of this list with 31 percent of students categorized as high needs. Swampscott leads once again with 39 percent of its students receiving this designation, and Hingham has the lowest percentage at 22 percent. See the chart below for the complete dataset.
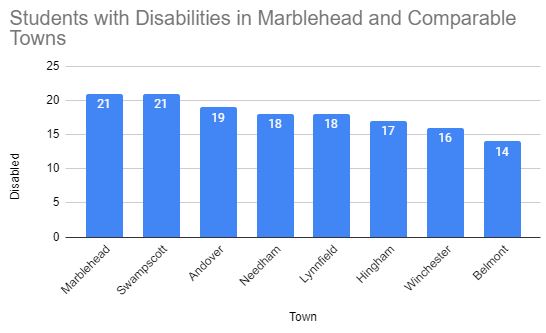
Students with Disabilities (%) - Marblehead has the Most
Marblehead is tied for the highest percentage of students with disabilities among the towns surveyed at 21 percent, which equals the number in Swampscott. Andover falls just below, with 19 percent in this category, and Lynnfield has the least, at 14 percent. See the chart below for the complete dataset.
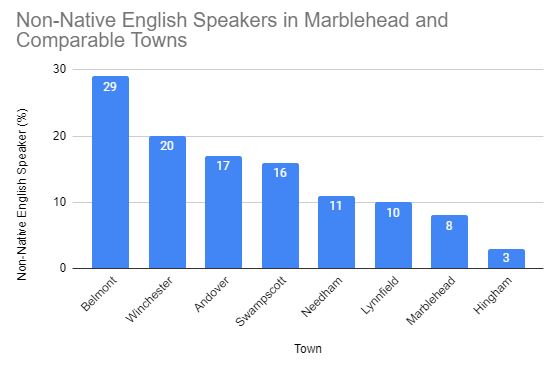
Non-Native English Speakers (%) - Marblehead Nearly Lowest
Marblehead has the second-lowest percentage of non-native English speakers (eight percent) of the comparable towns. Hingham is the only town with fewer, at three percent, and Belmont is the highest, with 29 percent of students speaking English as their second language. See the chart below for the complete dataset.
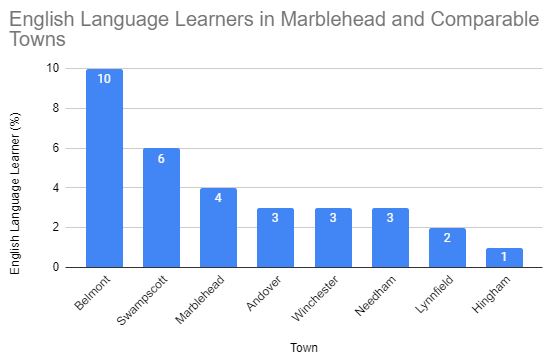
English Language Learners (%) - Marblehead Again in the Middle
Marblehead again falls in the middle of the list for percentage of English language learners, defined as students receiving specialized instruction in the English language. Marblehead is at four percent, while Belmont tops the list with 10 percent and Hingham brings up the rear, with just one percent. See the chart below for the complete dataset.
RELATED ARTICLES